Editor Tools II: Profiling CPU and GPU Performance

Performance profiling became the next major editor tool implemented in STAGE VK.
The engine already exposed basic frame information such as FPS and delta time, but this was only enough to know whether the application was running at an acceptable rate. It did not explain where CPU time was being spent, how long the GPU required to execute a frame, or what Vulkan work was being submitted.
The original performance panel was therefore replaced by a dedicated profiling architecture capable of collecting CPU, GPU and rendering information independently from the editor UI.
The result is the first version of the STAGE VK Performance Profiler.
1. Profiler Architecture
The main design goal was to keep performance measurement independent from visualization.
The editor should not be responsible for measuring the engine. Instead, a central Profiler collects data generated by the application, renderer and Vulkan backend, while PerformancePanel only reads and visualizes that information through Dear ImGui.

Each recorded frame is stored as a FrameProfileData containing information such as:
Frame number
FPS
Frame time
CPU frame time
GPU frame time
CPU profiling events
Rendering statistics
The profiler also maintains a fixed frame history, allowing previous frames to remain available for inspection while new frames continue to be recorded.
2. CPU Profiling
CPU profiling is implemented using scoped instrumentation.
A lightweight ProfileScope object records the beginning of an event when it is constructed and calculates its duration when it leaves scope.
This allows sections of the engine to be instrumented using a small macro:
PROFILE_SCOPE(profiler, "RenderModule::Render");Because the scope follows normal C++ lifetime rules, timing ends automatically when execution leaves the corresponding block.
Each CPU event also stores its nesting depth. This allows the profiler to reconstruct the hierarchy of the frame instead of displaying a flat list of timings.
The current instrumentation covers the main application phases:
Update
PreRender
Render
PostRender

It also reaches deeper into systems such as the Vulkan frame lifecycle.
For example, WaitForPreviousFrame measures how long the CPU waits for the previous GPU submission to complete before the command buffer can be reused. If this wait becomes expensive, it becomes directly visible in the profiler.
The CPU tab presents these events as an expandable hierarchy, displaying both the duration of each scope and its percentage of the profiled CPU frame.
3. GPU Profiling with Vulkan Timestamp Queries
CPU timers cannot accurately measure GPU execution.
Submitting a command buffer only measures the CPU-side submission work. The GPU may execute those commands later and independently.
For this reason, GPU frame time is measured using Vulkan timestamp queries.
A VkQueryPool stores two timestamps:
GPU Frame Begin
GPU Frame End
The difference between both timestamps represents the GPU time required to process the recorded frame.
The raw timestamp difference is converted using the physical device's timestampPeriod:
Timestamp Difference × timestampPeriod = GPU TimeThe previous frame's result is resolved after its fence has completed, ensuring that the GPU has finished writing the query results before the CPU attempts to read them.
The profiler also takes the queue family's timestamp validity into account when calculating the final value.

The GPU tab combines this timing information with data from the physical Vulkan device selected by the engine, including:
GPU name
Device type
Vulkan API version
Timestamp query support
Timestamp period
Current GPU frame time
Average GPU frame time
Minimum GPU frame time
Maximum GPU frame time
The current implementation measures the complete GPU frame. Individual GPU scopes and a hierarchical GPU view will become more useful later, once STAGE VK contains more independent rendering passes.
4. Frame History and Inspection
Profiling becomes significantly more useful when performance can be observed across multiple frames rather than only through the latest value.
The profiler therefore maintains a rolling history of recorded frames.
The Performance Panel visualizes the recorded timing data as a graph containing:
Frame Time
CPU Time
GPU Time
Performance spikes can therefore be located visually instead of disappearing as soon as the next frame begins.
The graph is interactive. Hovering over a frame displays its:
Frame number
FPS
Frame time
CPU time
GPU time

Frames can also be selected for inspection. Once selected, the rest of the profiler displays the information captured for that specific frame while recording can continue normally in the background.
5. Recording Controls
The profiler can be controlled directly from the Performance Panel.
The toolbar provides four main actions:
Record — resumes profiling.
Pause — stops recording new profiling frames without stopping the application.
Clear — removes the captured frame history.
Live — returns inspection to the latest recorded frame.
Pausing is particularly useful after detecting an interesting spike. The captured frames can be inspected without immediately disappearing from the rolling history.
Recording state changes are handled at frame boundaries so enabling or disabling profiling from the editor does not leave a partially recorded frame.

6. Overview and Frame Budgets
The Overview tab provides a higher-level interpretation of the profiling data.
Three timing measurements are shown together:
Frame Time — total elapsed time between application frames.
CPU Time — time spent executing the CPU work measured by the profiler.
GPU Time — time required by the GPU to execute the recorded Vulkan frame.
These values represent different parts of frame execution and are not expected to add together directly.
For each timing measurement, the profiler calculates:
Current
Average
Minimum
Maximum
The Overview tab also compares the current frame time against common performance targets:

The panel indicates whether the current frame remains within each target budget, providing a quick interpretation of the raw timing values.
7. Rendering Statistics
The final profiler view exposes information about the Vulkan workload recorded for each frame.
The Rendering tab currently displays information that STAGE VK can track reliably.
Rendering Context
Backend
Resolution
Swapchain image count
Current swapchain image
Frame Commands
Command buffers
Render passes
Queue submissions
Present calls
For the current renderer, a frame contain:
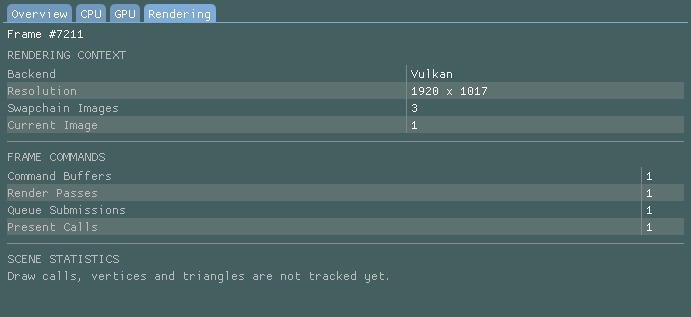
Statistics such as draw calls, vertices and triangles are intentionally not displayed yet.
The current renderer does not have enough centralized geometry submission infrastructure to guarantee that those counters would represent the complete frame correctly. They can be introduced later when the rendering architecture provides a reliable place to collect them.
⚠️ Final Result
The first version of the STAGE VK Performance Profiler establishes a foundation that can grow together with the renderer.
It currently provides:
CPU scoped profiling
CPU hierarchy
Vulkan GPU timestamp profiling
GPU device information
Frame history
Frame selection
Recording controls
Current / average / minimum / maximum timings
Frame-budget visualization
Rendering statistics
More importantly, the profiling system remains independent from the editor itself. Engine systems generate profiling data, the Profiler collects and stores it, and PerformancePanel is responsible only for visualization.
🚨 First Real Profiling Finding
While testing the profiler, I noticed an unexpected frame-pacing issue when running STAGE VK across two displays with different refresh rates.
The application was tested on:
Display A — 144 Hz
Display B — 60 Hz
On the 144 Hz display, frame times remained relatively stable and stayed inside the 120 FPS budget. On the 60 Hz display, the average performance remained similar, but the frame history showed frequent spikes that occasionally exceeded the 8.33 ms budget required for 120 FPS.

At first, the increased window size and resolution seemed like a possible explanation. However, the profiler showed that GPU execution was almost identical on both displays.
The average GPU time remained around 0.05–0.06 ms, meaning that the additional frame time was not being spent rendering more pixels.
Selecting one of the problematic frames on the 60 Hz display made the issue much clearer.
Frame #18256 took approximately:
Frame Time    14.86 ms
CPU Time      14.31 ms
GPU Time       0.07 ms
The frame was therefore CPU-bound during the spike, while GPU execution remained almost negligible.
The CPU hierarchy could then be used to trace the stall further:

More than half of the entire frame was being spent inside AcquireSwapchainImage. This led directly to vkAcquireNextImageKHR().
STAGE VK currently calls it with an infinite timeout:
vkAcquireNextImageKHR(device, swapchain, UINT64_MAX, imageAvailableSemaphore, VK_NULL_HANDLE, ¤tImageIndex);The renderer uses VK_PRESENT_MODE_MAILBOX_KHR, but MAILBOX does not guarantee that a swapchain image will always be immediately available.
On the 60 Hz display, presentation consumes images more slowly than on the 144 Hz display. When no image is available for reuse, vkAcquireNextImageKHR() waits until the presentation system releases one.
The profiler therefore revealed that the apparent performance problem was not expensive rendering, but a synchronization and presentation stall:
GPU rendering
    ~0.07 ms

Wait for previous GPU frame
    ~0.10 ms

Acquire next swapchain image
    ~7.61 ms   ← main stall
This was especially visible because the current STAGE VK backend only supports one frame in flight. The CPU reuses a single command buffer and synchronization context, which makes presentation-related waits directly visible in the main frame.
🛠️ Fix
The profiling results showed that the frame-time spikes were not caused by GPU rendering. The main stall occurred inside vkAcquireNextImageKHR(), which occasionally had to wait several milliseconds for a swapchain image to become available.
The first change was to remove the strictly serialized single-frame lifecycle and introduce two frames in flight.
STAGE VK now maintains two independent frame slots. Each slot owns the resources that must not be reused while its previous GPU submission is still executing:
Frame Slot 0
├─ Command Buffer
├─ Image Available Semaphore
└─ In-Flight Fence

Frame Slot 1
├─ Command Buffer
├─ Image Available Semaphore
└─ In-Flight Fence
Render-finished semaphores remain associated with individual swapchain images, since presentation may still be using the semaphore belonging to an image after the CPU has already advanced to another frame slot.
The Vulkan GPU profiler was also updated to support the new frame model. Instead of sharing one pair of timestamp queries between every frame, each frame slot now owns its own query range. GPU timings are associated with their original profiler frame number when the corresponding fence is eventually resolved.
However, multiple frames in flight alone did not completely eliminate the acquisition stalls.
The application was still producing frames much faster than the display could present them. On the 60 Hz monitor, the renderer could generate several frames during a single display refresh interval. Even with VK_PRESENT_MODE_MAILBOX_KHR, this could eventually leave no swapchain image immediately available, causing vkAcquireNextImageKHR() to block.
To prevent the renderer from continuously outrunning the presentation system, I added an explicit frame pacing system.
The frame pacer detects the refresh rate of the monitor currently containing the application window and calculates the corresponding frame interval:
60 Hz  → 16.67 ms
144 Hz →  6.94 ms
After the engine finishes its CPU and GPU submission work, the pacer waits for the remaining frame time before starting the next frame. Most of the wait uses sleep_until(), followed by a short high-precision spin period to reduce scheduler overshoot.
Before the fix, STAGE VK was effectively running unrestricted and relying on the presentation system to absorb the excess frame production. When the renderer outran the display for long enough, vkAcquireNextImageKHR() occasionally had to wait for a swapchain image to become available, producing the visible frame-time spikes.
After the fix, frame production is paced deliberately against the refresh rate of the active display. The engine completes its rendering work, submits and presents the frame, then waits only for the remaining portion of the target frame interval before starting the next one. This keeps swapchain acquisition lightweight and prevents presentation from becoming an accidental frame limiter.
The result on the 60 Hz display was significantly more stable.
AcquireSwapchainImage, which previously produced stalls of several milliseconds and reached approximately 11 ms in the captured worst case, dropped to approximately 0.026 ms.
Frame pacing also stabilized close to the display refresh rate, at approximately 59 FPS, while the actual CPU workload remained around 4 ms and GPU execution around 0.2 ms.
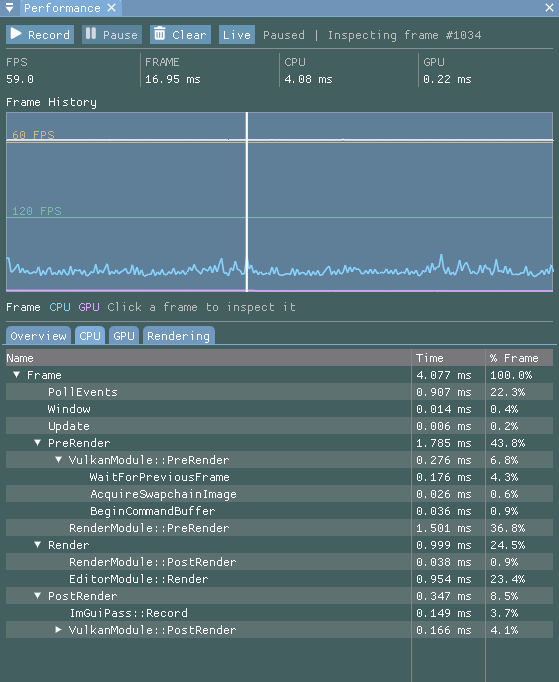
The important result is that the application is no longer relying on vkAcquireNextImageKHR() to accidentally regulate its frame rate. Presentation pacing is now handled deliberately by the engine, while swapchain acquisition remains a lightweight part of the Vulkan frame lifecycle.
The current architecture also leaves room for future additions such as:
GPU scopes per render pass
GPU hierarchy
Vulkan debug labels
Vulkan object names
RenderDoc integration
Draw-call statistics
Geometry statistics
Memory profiling
But that's out of the scope at this moment and it will be implemented in the future.


Comments